In scheduling operations today, as in any business, data is the key to success. Organizations that have the tools needed to analyze the data they capture invariably perform better than those that don’t.
It just makes sense. If you can spot and address weaknesses in your processes and emphasize your strengths, everyone will be happier—including your customers, scheduling team, and other stakeholders.
That’s where Mazévo Analytics comes in.
Your Mazévo database is a treasure trove of information that grows every day. Without you having to lift a finger, the data accumulates and starts to reveal room use trends, customer preferences, and much more. And using Mazévo Analytics—a feature integrated into your system—you can make sense of all that information with just a few mouse clicks or taps on your mobile device
Benefits of Using Mazévo Analytics
You’re busy, so you may be thinking, “Why should I take even a few minutes out of my day to learn about and experiment with Mazévo Analytics?” Fair question!
The reason it’s worth the small amount of time and effort involved is that this functionality delivers several benefits, including that it enables you to:
- Optimize facility utilization to ensure you’re able to meet demand.
- Assess how your resources and staff member time are utilized—especially during peak times—and make changes if necessary to cover requirements.
- Improve the customer experience by assessing whether your services are aligned with their needs and expectations.
- Plan and forecast more effectively.
- Reduce operational and maintenance costs through actions like repurposing existing space so you don’t have to build new facilities.
Questions Mazévo Analytics Can Answer for You
The above list of benefits surely sounds appealing to anyone involved in meeting and event scheduling. But you might be wondering exactly what kinds of insights you can get from Mazévo Analytics.
Here are some questions Mazévo users get answers to every day using this powerful feature:
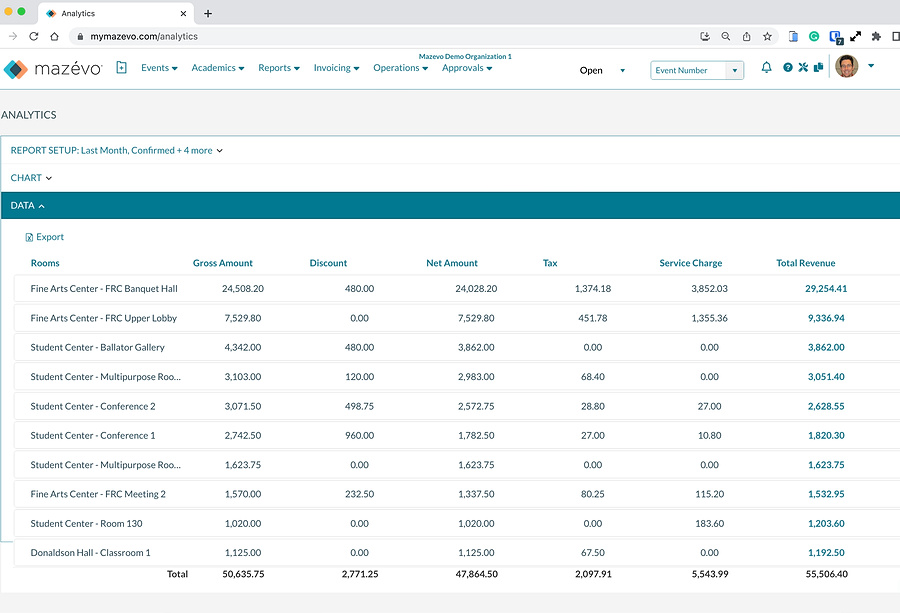
- Which customers generate the most revenue for our facilities?
- Which customers use the space the most? And is this consistent with my department/organizational mission?
- What is the adoption rate for our online facility request form?
- How many requests are submitted by customers online?
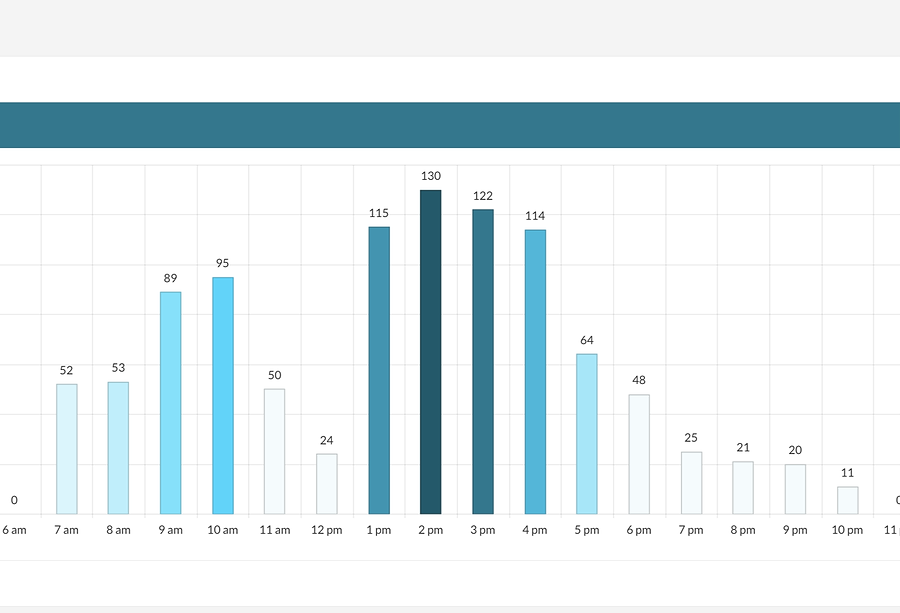
- When is my facility the busiest?
- What types of events drive the most attendance and revenue?
- Can I repurpose some of my rooms to accommodate demand?
- Which event services generate the most revenue?
- Which resources do customers use most frequently and may require service or replacement sooner than others?
- Would purchasing more of specific resources mean less “juggling” and happier customers?
Imagine getting the data to answer these and other questions in seconds rather than hours wrestling with spreadsheets!
Mazévo Analytics Features That Can Make Your Life Easier
Our analytics capabilities are designed with ease-of-use in mind. Some of the ways that Mazévo Analytics achieves that goal include:
- Generating data “visualizations” like charts and graphs

- Providing many ways to filter data so you can access only the information you need
- Enabling users to drill into the data to understand the context

- Simplifying the export of data for further analysis in other programs
- Streamlining the dissemination of data with shareable links
Get Started Today With Mazévo Analytics!
If you’re intrigued about the ability to analyze information from your scheduling operations efficiently and make better, data-driven decisions, there’s no better time to get started! And if you have questions about Mazévo Analytics (or any feature), we’re always happy to answer them. Contact us anytime!


